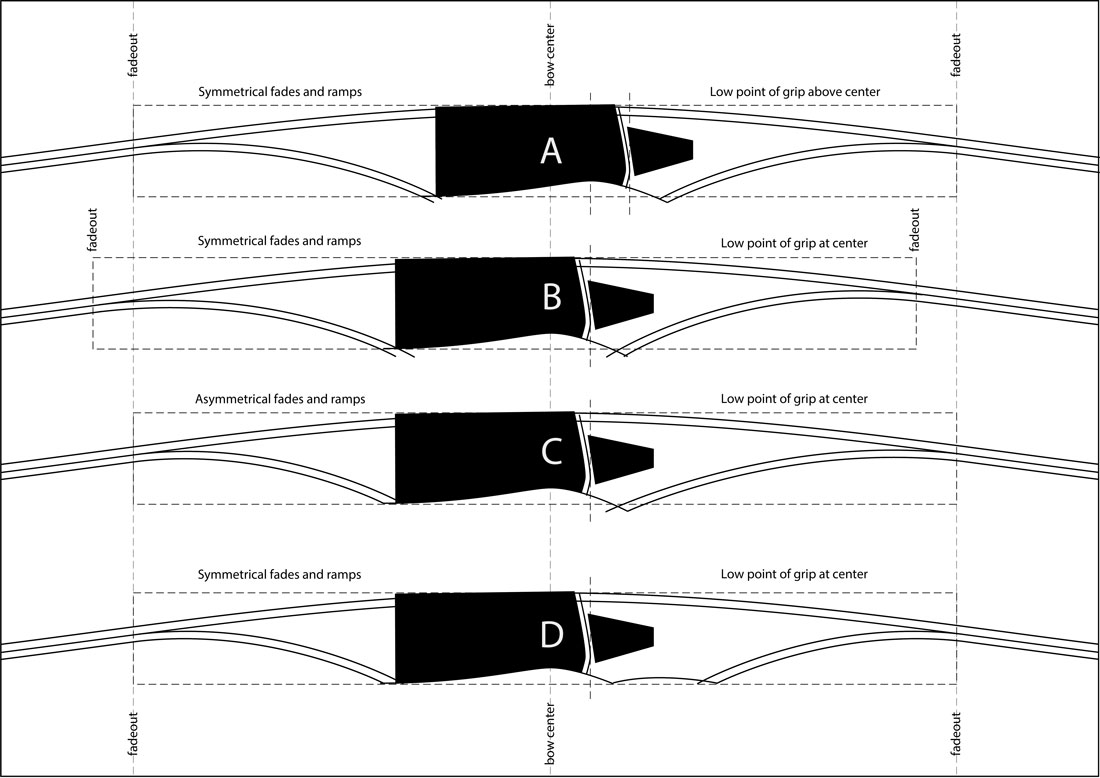
I’ve experimented with making longbows with four different riser layouts. Riser A represents probably the…
How to make and read a force/draw curve (part 2)
How to MAKE a force/draw curve
Welcome to part two of the series! In part one, we learned how to build a bow weighing rack and measure the draw weights of our bow at each one inch increment of the draw. We recorded the data on a note pad and saved it for part two. Now, in part two, we will enter that data into a table and create a line graph showing the force/draw curve.
The following quote is from The Dealer’s Workbench, By Larry Wise. Click >here< to see the document.
“DEFINITION: An ARCHERY BOW FORCE-DRAW CURVE is the two-dimensional graph plotting of the bow’s draw weight in pounds (#) versus its draw length in inches (“), measured at each inch, for the entire draw stroke of the bow. The pounds of force are plotted on the vertical axis of the graph while the inches of draw length are plotted on the horizontal axis.”
That pretty much summarizes what a force/draw curve is. In simple terms, it measures the force necessary to draw a bow from brace height to the full draw position. The force values taken at increments of draw length are then plotted versus draw length using rectangular coordinates. When the draw force/draw length coordinates are connected together, the resulting curve is known as the force-draw curve.
Downloading and saving a copy of the spreadsheet template
We COULD plot the coordinates onto graph paper by hand, but I promised to make this really easy, so I created an Excel spreadsheet template that you can download and simply type in the data and then let Excel do all of the calculations and draw the force/draw curve for you. You need to have a copy of Microsoft Excel to use this template. Excel is included with the Microsoft Office suite software package that comes on most PC computers, so it is likely that you already have the program.
Click here to download the Excel spreadsheet template
Once the file has downloaded to your computer, save it to the desktop or make a folder to save it with the files you create for each one of your bows. Double click on the template file to launch the file, or launch the Excel application, then open the file from there.
Now that you have the template file open in Excel, do a “save as” to save it as a new file with a new name. This will create a new copy of the file and leave the original template file unchanged. With that new file open, you are now ready to create the force/draw curve.
The photo below is a screenshot of the Excel spreadsheet saved for the bow from which I collected the draw force data…

Entering the data into the table
You’re going to love how easy this is when using the template. First, enter the details about your bow in the yellow cells at the top left corner of the sheet (bowyer, bow model, bow length, string length, string type, string strands, brace height, draw length, arrow weight and arrow speed average). The details in these cells are just labels except for the Arrow Weight and Arrow Average Speed values which are used in the built-in formulas to calculate arrow kinetic energy (Arrow K.E.), and Dynamic Efficiency. I measured a three shot average arrow speed of 191 feet per second (fps) for this bow on a shooting machine so I entered that into the table. The spreadsheet is set up to automatically calculate all of the values in the blue cells.
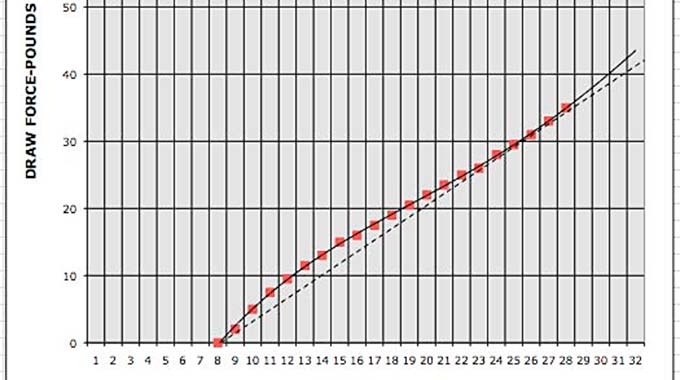
To create the force/draw curve, all you need to do is to enter the draw force values of your bow at each inch of the draw from your notepad into the yellow cells in the table on the left side of the sheet. Since the brace height for this bow is 6.25”, I entered the first draw force value of 0.00 lbs in the DR FORCE (LBS) column next to the 8.00 value in the DR LNGTH (INCHES) column. I started entering the data at 8.00” because the brace height plus 1-3/4” equals the AMO draw length (6.25” + 1.75” = 8.00”). Just type in 0.00 and press “enter.” Then type in the next draw force value next to 9.00” and press “enter.” Continue this down the table until all of the values out to full draw (28” on this bow) are entered into the table. You can enter values past 28” draw, but note that if you do, the dynamic efficiency value will go down.
As you were entering in the data, you probably noticed that the DRAW FORCE CURVE was being automatically generated on the graph on the right side of the spreadsheet.
Now, the only thing left to do is to move the straight, dashed line up under the FDC. Click on the left endpoint of the line and drag it to the 8”, 0 lbs coordinate at the bottom of the graph. Then click on the right endpoint of the line and drag it to where the line is located right up next to the bottom of the sweet spot of the force/draw curve.
Congratulations…you just made a beautiful force/draw curve for your bow!
Now let’s look at the values automatically calculated in the table:
The CHANGE PER INCH column calculates the change in draw force (lbs) in each one inch distance of bow string nock travel during the draw. I find this column to be very useful when evaluating the bow. I’ll talk about how to interpret this column in the final post about reading the FDC.
PEAK DRAW FORCE (P.D.F.) (measured in lbs) represents the maximum draw force recorded between brace height and full draw when the bow was drawn and weighed.
STORED ENERGY (S.E.) (measured in lbs) is the sum of all draw force values of the bow at each one inch of the draw (all of the draw forces at each inch added together). Another way of saying this is that the stored energy of the bow is the area under the curve between the positions of brace height and full draw. We have recorded the draw weight as pounds-per-inch (or inch-pounds). Since stored energy is represented by units of foot-pounds, the sum we recorded must be divided by 12 to convert it into foot-pounds.
STORED ENERGY divided by PEAK DRAW FORCE (S.E./P.D.F.) (measured in foot-lbs/lbs) creates a ratio comparing the amount of energy the bow can store vs. the difficulty of pulling the bow to full draw. This ratio can be used to compare bows. A hunter might be interested in having a bow that is capable of storing the maximum amount of energy for a given amount of work required in pulling the bow…that is for a given peak draw weight. In other words, most hunters want to have the highest return from their effort.
ARROW K.E. (arrow kinetic energy) (measured in foot-lbs) represents the energy stored in the arrow. Arrow kinetic energy is calculated by multiplying the weight of the arrow times the velocity of the arrow times the velocity of the arrow (again) divided by a constant of 450,240. The 450,240 is a conversion factor that straightens out all fuss with units (fps & grains) and gives us a plain answer in ft-lbs.
DYNAMIC EFFICIENCY (a percentage) is a comparison of the energy transfered to the arrow vs. the energy stored in the bow before the arrow is released. It is represented as a percentage. Like most percentages, it is calculated by dividing the arrow kinetic energy by the stored energy (of the bow), then multiplied by 100 to make it a percentage.
I guess that’s about all there is to say about making the FDC using the template.
Watch for the next part of the series. In part 3, I’ll show you how to read the table and graph and interpret what it tells about the bow. You’re REALLY going to like knowing how to evaluate your bow by reading the force/draw curve!
Click the links below to see the other posts of the series:
Part 1: How to set up a bow weighing rack.
Part 3: How to READ a force/draw curve.
See you on the next post!
Click “Like” below to share this post with your friends, and please feel free to leave a comment or ask a question.
Related Posts

I certainly appreciate your articles and the fact you have placed a downloadable template here for people to use. I have been building self and sinew backed bows for only 3 years, and I’m finally producing some sweet shooting osage hunting bows. I would love to start keeping track of as many different aspects of performance vs design as I attempt to make my bows better hunting tools, and this template will/would be a huge benefit to me. That said, when I attempt to download the F/D template, it simply won’t do anything. Is this something that was once, but no longer is available? I’m 53yo, so I am just old enough that nothing computer or tech related is intuitive. I’d need an in-person class and a whole different level of motivation to get to where trying to create an excel spreadsheet wouldn’t cause me to take a hammer to my computer. If there is any way you can direct me to a way to download this F/D template, I would appreciate it tremendously.
Thanks for letting me know. I’ll check it out and fix it.
Hey Eric, I checked the page and I am able to download the template both on my iphone and on my laptop computer. After downloading I was also able to open the template in Excel. Please check your downloads folder in your browser to see if it was saved there. Sometimes this happens automatically without telling you it happened.
In the example of the template that you show above, the stored energy is ~31.00 ft.-lbs., not 32.46 ft.-lbs.. You will get a much more accurate estimate of the area under the curve using the trapezoidal rule, where the area under the curve for the interval L0 to L1 = (L1-L0)*(F(L0)+F(L1))/2 and the area under the entire curve is the sum of the all interval areas. I would recommend inserting the following formula into cell F14 (or wherever you want to put it): =IF(D14=””,””,AVERAGE(D13:D14)*((C14-C13)/12)). The formula for cell E49 should be =SUM(F14:F46).