A Force/Draw Curve is a useful tool that shows a visual representation of the draw weight of your bow at each one inch increment of the draw stroke.
Click here to download the Excel Spreadsheet Template that I created for making a force/draw curve.
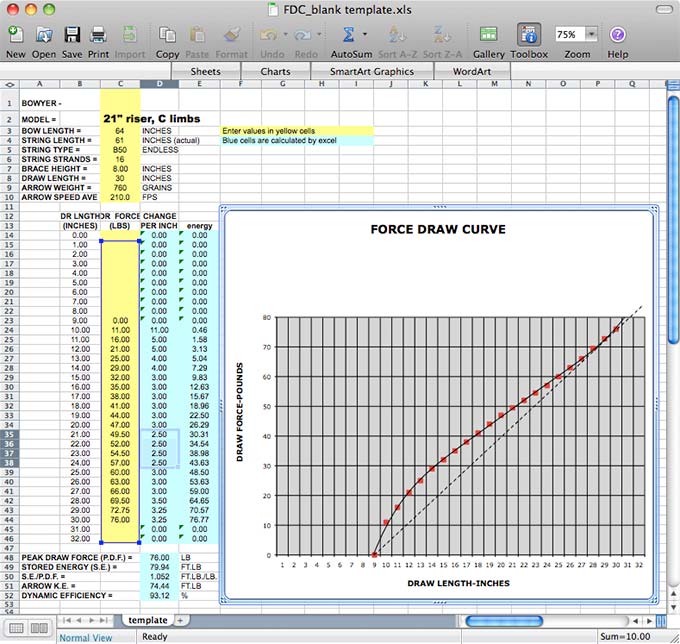
Just enter the draw force values of your bow for each inch of the draw into the yellow cells. The spreadsheet will automatically calculate all of the results in the blue cells and draw the red Force Draw Curve on the right.
For your table and chart to be AMO-friendly, enter your first draw weight entry of 0.00 lbs at brace height plus 1-3/4″. For example, the bow in the chart shown starts with 0.00 lbs at 9″, so it has a brace height of 7-1/4″ (7-1/4″ plus 1-3/4″ equals 9″). This is because AMO specifications are for measuring all bows (recurves, longbows, selfbows, etc.) from the virtual “back of the bow” which AMO considers to be 1-3/4″ from the deepest point of the grip. This is to make comparisons more consistent between bows with different handle thicknesses.
Before recording draw weights, you’ll want to set up the ruler on your tillering tree or bow drawing rack so it starts at zero at 1-3/4″ (towards the back of the bow) from the deepest point of the grip.
You can also enter the details about the bowyer, model, and bow specifications. Most of these are just labels, but the Arrow Weight and Arrow Average Speed are used in the efficiency formulas for stored energy (S.E.), stored energy divided by peak draw force (S.E./P.D.F.), arrow kinetic energy (Arrow K.E.), and Dynamic Efficiency.
After the force draw curve is generated, you can click and drag the straight dotted line to move it close under the force draw curve. The dotted line represents a direct relationship between draw weight and draw length. Comparing the draw curve to the straight dotted line helps us see how the rate of draw weight increase is changing throughout the draw when the curve is converging towards or diverging away from the dotted line. The bow is “stacking” where the curve starts rising up and away from the dotted line. Stacking occurs when the draw weight is increasing at an increasing rate, usually in the final inches of the draw.
In the table, the “Change Per Inch” column is useful to see where the bow is actually beginning to stack based on the numbers. Even though the curve on the graph looks like the bow is not stacking at all completely out to 32″, the “Change Per Inch” column shows that the bow has actually started stacking between 24″ and 25″ (it gained 0.5 lb. between 24″ and 25″). You probably won’t be able to feel this small amount of bow stacking starting at 24″ but the numbers do not lie. This particular bow has a very sweet draw stroke and I can’t tell that it is stacking at all when drawing the bow clear out to 32″. The stacking can’t be felt on this bow because the draw length has only increased about 0.75 lb in the last eight inches of the draw. In fact, it might be best to just call it a “valley” on this curve. I think a bow has to increase in draw weight up to 0.5 lbs. per inch before you can begin to feel it stacking during the draw.